Excel Advanced Concepts - Additional Data Analysis tools - Data validation, Subtotal and What-Ifs This 90-minute webinar focuses on some of the additional tools available in Excel that are very useful but often overlooked. We'll talk about data validation, the Subtotal feature (an alternative to pivot tables), Find & Replace, and Conditional Formatting. Additional Data...
Google Docs and Sheets Basics: Get started with Google's popular text and spreadsheet applications In this 90-minute webinar we'll explore Google's online alternatives to MS Word and Excel. Google Docs can be used to create letters, reports, resumes and other text-based documents. Google Sheets allows you to create spreadsheets using many of the same functions...
Pace Bus Hiring Event at Harper College! Looking for a great job? Meet with Pace Bus at this special pre-hire event at Harper College! This event will help prepare you for employment with Pace. 2023.03.25 -Pace hiring event flyer ArlingtonHts_3.25.2023 (DOWNLOAD flyer with DETAILS) Saturday March 25, 2023 9am - 2pm SESSION A...
Excel Advanced Concepts - Get Started with Excel Tables You've heard of Excel tables but never had a chance to use them? Learn how to structure Excel tables, understand the differences between normal ranges and tables, and the advantages of using tables to create more complex pivot tables. Registration ends by 5pm the day prior...
2023.03.29 -Techapalooza Flyer_March 2023_FINAL_for job seekers
CLICK BELOW TO DOWNLOAD FLYER 2023.03.29 HANOVER PARK Job-Fair Flyer-with speaker
Excel Advanced Concepts: Customize your spreadsheet with Conditional Formatting, Links, Protection and basic macros This 90-minute webinar focuses on some of the additional tools to help you customize your spreadsheet. We'll look at Conditional Formatting, different types of protection, link options and how to get started with VBA macros. Registration ends by 5pm the day...
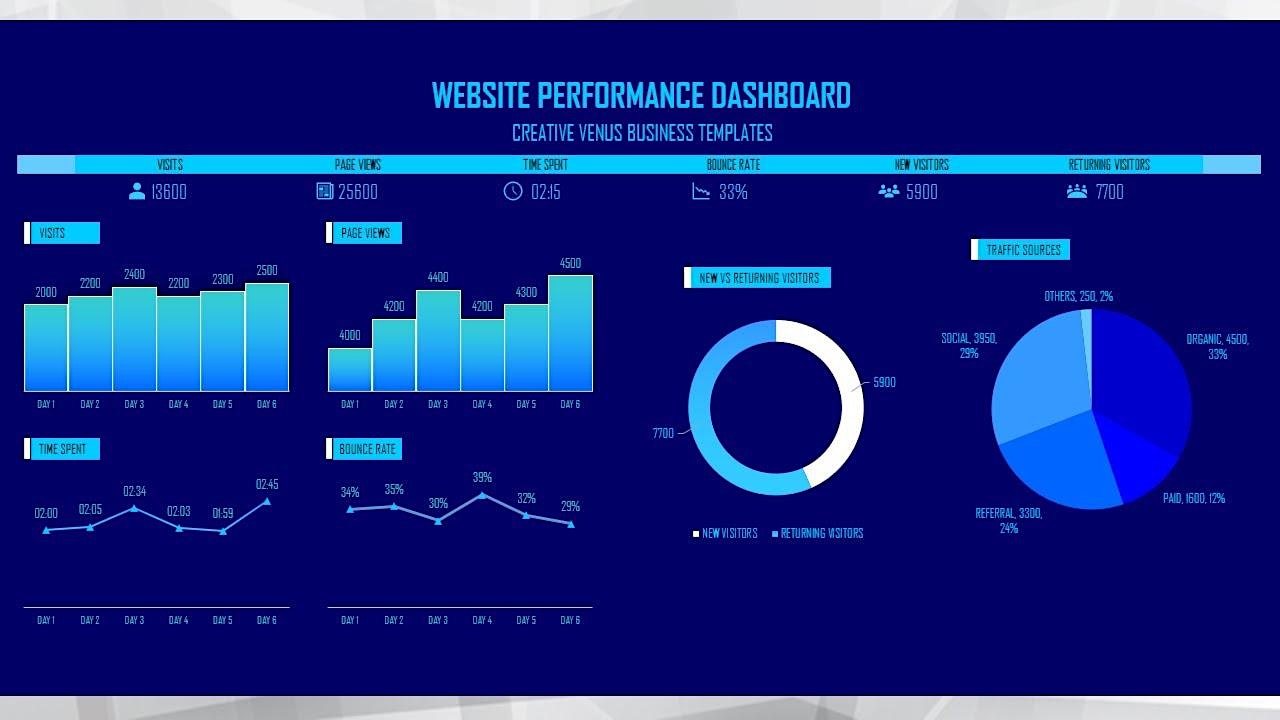
Excel Advanced Concepts - Dashboards: Use PivotTables, Sparklines, Charts, VLOOKUP to create Excel Dashboards Dashboards are at-a-glance summaries that use graphics to illustrate progress towards a goal. Excel has a number of features like PivotTables, PivotCharts, Sparklines, and Functions that can be combined to create surprisingly robust dashboards. We highly recommend you have some familiarity...
Canva Basics - Create content for print, presentations and social media with this free online graphic design app You don't need to be a graphic designer to produce professional looking designs! By utilizing Canva's built-in templates, photo and font options anyone can create exciting content to be shared online, posted on social media site, or...